Did the AI Beat the Market? The Trading Playground Results
Published on
The Results Are In
Back in March, I asked a simple question in Can an AI Researcher Beat the Market?: could an AI deep research tool, plugged into a sandbox trading engine, manage a profitable high-growth portfolio over six months?
I gave it $100,000 of Monopoly money, a brief to hunt for "asymmetric growth and multi-bagger returns within a 6-12 month horizon", and a feedback loop: the AI researches and recommends, the Trading Playground checks each trade against live prices and available cash and executes it, and the results go back to the AI the next day.
The six months are up (plus a couple of extra months, because I wanted to see how the story ended). So, did the AI beat the market?
Yes, emphatically. And then, no.
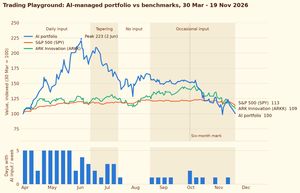
The Headline Numbers
The portfolio started trading on 30 March 2026. The data below runs to the close on 19 November.
| AI portfolio | S&P 500 (SPY) | ARK Innovation (ARKK) | |
|---|---|---|---|
| Peak (2 June) | +123.4% ($223,408) | +20.2% | +25.8% |
| Six-month mark (30 Sep) | +51.5% ($151,543) | +20.8% | +40.3% |
| End of data (19 Nov) | +0.3% ($100,333) | +13.3% | +8.5% |
I included ARKK alongside the S&P 500 because the AI was explicitly told to chase high-growth, high-risk names. ARKK is a fairer benchmark for that kind of strategy than an index full of banks and supermarkets.
On the measures I promised to track in the original post:
- Total return vs the S&P 500: comfortably ahead at six months (+51.5% vs +20.8%). Behind by the end (+0.3% vs +13.3%).
- Win rate: 65% of the 136 sell trades were profitable. The average win was $1,272 and the average loss was $1,628, so the losses were bigger than the wins.
- Maximum drawdown: -55.9%, from the $223,408 peak on 2 June to $98,601 on 5 November. The S&P 500's worst drawdown over the same period was -8.1%.
- Sharpe ratio (risk-adjusted return, assuming a 4% risk-free rate): 1.5 at the six-month mark against 2.6 for the S&P 500, and 0.28 against 1.1 by the end. Even at its best, the portfolio never beat the index once you allowed for the risk it was taking.
- Volatility: 67% annualised against 14% for the S&P 500. On average, the portfolio moved about three times as much as the market (a beta of 3.1). It swung 16% up on its best day and 11% down on its worst.
Over the whole period it made 322 trades across 50 different stocks, plus 371 HOLD recommendations and 373 limit or pending orders (251 filled, 76 expired and 46 cancelled). It bought $1.2 million of stock in total, so it turned over its starting capital about twelve times.
At the end, the books balance almost exactly. It locked in +$36,669 in realised gains, and the ten positions it still holds are -$36,336 below what it paid for them. Eight months of frantic, well-reasoned trading, and it ended up exactly where it started.
The Confession: I Stopped Turning the Crank
I need to own something before we go any further.
The design relied on a daily loop: export the portfolio, run the AI research, import the recommendations. That loop doesn't run itself. I was the one turning the crank. For the first ten weeks, I did it every trading day. After that, I did it less and less often.
The Playground's import history makes this very clear. I've split the experiment into four phases based on how often the AI was actually consulted:
| Phase | Dates | Days with AI input | AI portfolio | S&P 500 | ARKK |
|---|---|---|---|---|---|
| Daily input | 30 Mar - 12 Jun | 46 | +92.3% | +17.4% | +19.1% |
| Tapering | 12 Jun - 13 Jul | 10 | -18.8% | +1.0% | +3.4% |
| No input | 13 Jul - 17 Aug | 0 | +5.4% | +3.1% | +4.5% |
| Occasional input | 17 Aug - 19 Nov | 10 | -39.0% | -7.4% | -15.7% |
It's very tempting to read that table as "the AI was brilliant until I stopped feeding it". Some of that is true. But the honest version is more interesting.
What daily input actually bought
During the daily phase, the AI did more than pick stocks. It managed them. It trimmed winners, took profits, cut losers quickly and recycled the cash into whatever had momentum. The realised win rate tells the story:
| Month | Sell trades | Realised P&L | Win rate |
|---|---|---|---|
| April | 46 | +$35,813 | 85% |
| May | 28 | +$36,141 | 79% |
| June | 23 | +$23,437 | 78% |
| July | 12 | -$17,153 | 17% |
| August - November | 25 | -$41,450 | 28% |
The biggest winners were all made in that first phase: Nebius (NBIS, +$19.2k), POET Technologies (+$12.3k), Oklo (+$11.1k) and IonQ (+$9.6k).
Here's the key design point. The Trading Playground has no risk controls of its own. Orders only last for one trading day, there are no standing stop-losses, and nothing trims a position that has grown too big. All of the risk management lived in the AI's reasoning, and it only happened when someone ran the AI. Once the daily loop stopped, the portfolio became a buy-and-hold basket of very volatile stocks with nobody watching it.
Where the "less input = worse results" story breaks down
The five weeks with no input at all were actually fine. The portfolio was 99.7% invested (it had $436 in cash) and it rose 5.4%, slightly ahead of both benchmarks.
The real damage happened in the two phases where the AI was still trading, but only occasionally:
- Tapering (June - July): the portfolio fell 18.8% while ARKK rose. The main losses came from AI-infrastructure and nuclear names: IREN (-$9.1k), Applied Digital (-$5.9k), Oklo (-$5.4k), Centrus Energy (-$4.5k) and Nano Nuclear Energy (-$4.2k). With input every few days, the AI was reacting to week-old news and selling after the fall, not before it.
- Occasional input (August - November): the portfolio lost 39% while ARKK lost 15.7%. That's roughly what you'd expect from a portfolio with three times the market's volatility in a high-growth sell-off.
I also can't separate my reduced input from a change in the market itself. Spring 2026 was a fantastic time to own small-cap nuclear, space, quantum and AI-infrastructure stocks. Autumn was not. The AI's best period coincided with a speculative boom, and my reduced involvement coincided with the boom ending. Both things are true, and with one portfolio and one timeline there's no clean way to work out how much of the decline each one caused.
What the AI Got Right
The quality of the reasoning was genuinely impressive. Every trade came with a specific, numerate rationale: contract wins, cash runways, price-to-sales multiples, short interest, upcoming earnings dates. After the first few days it also attached a bull case and a bear case with estimated probabilities. It read like the work of a diligent junior analyst, not a chatbot making things up.
It invented its own risk framework when things went wrong. After the summer drawdown, with nobody asking it to, the AI started citing "circuit breaker" rules. On 18 August it made "mandatory" trims to keep every holding under a 7.5% position cap and every theme under a 17.5% cap, and raised $73,000 in cash in a single session. By 3 September it had halved its own position cap to 5% and was enforcing "trailing stop" exits. Through September the portfolio held about 60% cash and was essentially flat while the market drifted.
It beat a fair benchmark when it was being run properly. In the daily phase it returned +92% against ARKK's +19%. Most of that is explained by leverage to a hot sector, but not all of it.
What the AI Got Wrong
It kept fishing in the same pond. All 50 stocks it traded came from a handful of related themes: AI data centres and ex-bitcoin miners (Nebius, IREN, Applied Digital, TeraWulf, CoreWeave), nuclear (Oklo, Centrus, NuScale), space (Rocket Lab, AST SpaceMobile, Intuitive Machines, Redwire) and quantum computing (IonQ, Rigetti, D-Wave). Ten holdings sounds diversified. Ten holdings that all rise and fall on the same "AI needs power and compute" story is really one big bet.
Its rules didn't last from one session to the next. On 3 September it sold its entire Oklo position at $39.53, because the stock was "down 31.27% from cost, breaching trailing stop limits". On 1 October it bought 250 shares back at $37.03, praising the company's "exceptional balance-sheet protection against total capital loss". On 13 November it sold the lot at $23.16. Each decision made sense on its own terms, but taken together they contradict each other. The AI has no persistent memory of its own principles, only whatever the portfolio export happens to show it each session.
It loved averaging down. By October the most common justification was some version of "down X% from its 52-week high, so it's an asymmetric entry". On 28 October it added to AST SpaceMobile because it was "down ~70% from its May peak". Two weeks later it sold the whole position at a further 23% loss. In a falling market, "it's cheaper than it was" isn't an investment thesis.
It reported its uncertainty, but didn't act on it. The bull and bear probabilities sounded rigorous, but they were the AI's own estimates and nothing ever checked them against what actually happened. A "65% bull case" was just a guess with a number attached.
What I Learned
- The process is the strategy. A daily research loop only works if it runs daily. If I ran this again, I'd schedule the research and import step to run automatically, rather than relying on me remembering to do it.
- Put the guardrails in the boring software, not the clever software. In The Magician's Assistant I said the right pattern is "the AI decides; the boring software double-checks". Here, the boring software checked prices and cash, but not risk. Position caps, sector caps and stop-losses belong in the execution engine, where they're enforced every hour, whether or not anyone has run the AI that day.
- Judge returns against the risk taken. A +123% peak sounds incredible until you notice it came with three times the market's volatility. At no point did the AI beat the index once that risk was taken into account.
- Pick the benchmark that matches the strategy. Against the S&P 500 the portfolio looked like a genius at six months. Against ARKK it looked a bit less special.
- A good argument isn't the same as a good decision. The AI's reasoning was excellent at every step. The portfolio still went round in a circle.
So, Can an AI Researcher Beat the Market?
Over six months, measured on raw returns? Yes: +51.5% against +20.8% for the S&P 500.
Over the whole experiment, measured on risk-adjusted returns, with an imperfect human in the loop? Not this time. It had a brilliant spring, a rough summer and a brutal autumn, and finished almost exactly where it started while the index gained 13%.
The most useful lesson is that the AI was never the weakest link. The system around it was. The research was thoughtful, specific and fast. What was missing was the dull infrastructure: a scheduler that never forgets, risk limits that can't be argued with, and a memory of the rules the AI set for itself.
Which gives me an idea for version two...
As always, this was an experiment with Monopoly money, not financial advice.